Artifact type: Trading strategy specification
Audience: Technical readers and developers evaluating or implementing strategy logic
Role: Documentation author
Note: The document describes system behavior only and does not provide financial advice.
Project Tealeaves
| Version | Date | Author | Notes |
|---|---|---|---|
| 1.0 | 2026-03-05 | ao-ink | Initial release |
1. Purpose and Scope
1.1 Purpose
This document specifies the Tealeaves breakout signal model and its reference implementation. It defines the model's signal rules, trade lifecycle behavior, and operational constraints.
1.2 Scope
The document covers signal generation, band construction, stop and target calculation, trade state behavior, and platform implementation considerations.
The following elements are explicitly excluded:
| Area | Status | Notes |
|---|---|---|
| Position sizing | Informational | Example formula provided but not implemented in the indicator |
| Portfolio management | Excluded | No multi-position handling |
| Transaction costs | Excluded | Slippage and fees not modeled |
| Backtesting | Excluded | Indicator only; no performance evaluation included |
| Performance claims | Excluded | No profitability assertions made |
2. Model Design and Intent
2.1 Design Intent
The model was developed to replace discretionary trendline analysis with rule-defined breakout criteria.
Discretionary trendline analysis refers to manually drawing trendlines by visually selecting swing highs and lows on a price chart. The placement of these lines depends on analyst judgment rather than fixed mathematical criteria.
Manual selection of swing points introduces subjectivity. The Tealeaves model formalizes breakout detection using fixed mathematical rules.
The objective is to:
- Remove visual discretion from entry timing
- Define explicit signal criteria
- Bound risk at activation
- Maintain a single active trade state for clear signal attribution and evaluation
2.2 Model Description
Tealeaves generates a signal when price exits a defined band structure and satisfies confirmation conditions. Stops and targets are assigned at activation using Average True Range (ATR)-based distances.
2.3 Operating Assumptions
The model assumes that range compression may precede directional expansion and that breakout events may continue in the direction of the move. Volume is treated as a participation signal confirming breakout strength. ATR is used to normalize stop and target distances across instruments.
3. Model Execution Flow
The following diagram illustrates the operational flow surrounding the model, including candidate selection, signal evaluation on the chart, and post-trade logging and review.
The model itself generates signals only; trade execution is performed manually by the user.
Figure 1: Operational workflow surrounding the signal model.
3.1 Execution Environment
The reference implementation is written in TradingView Pine Script (v6).
The model runs as a chart indicator. Inputs are configured through the indicator settings panel. The script evaluates conditions on each completed price bar.
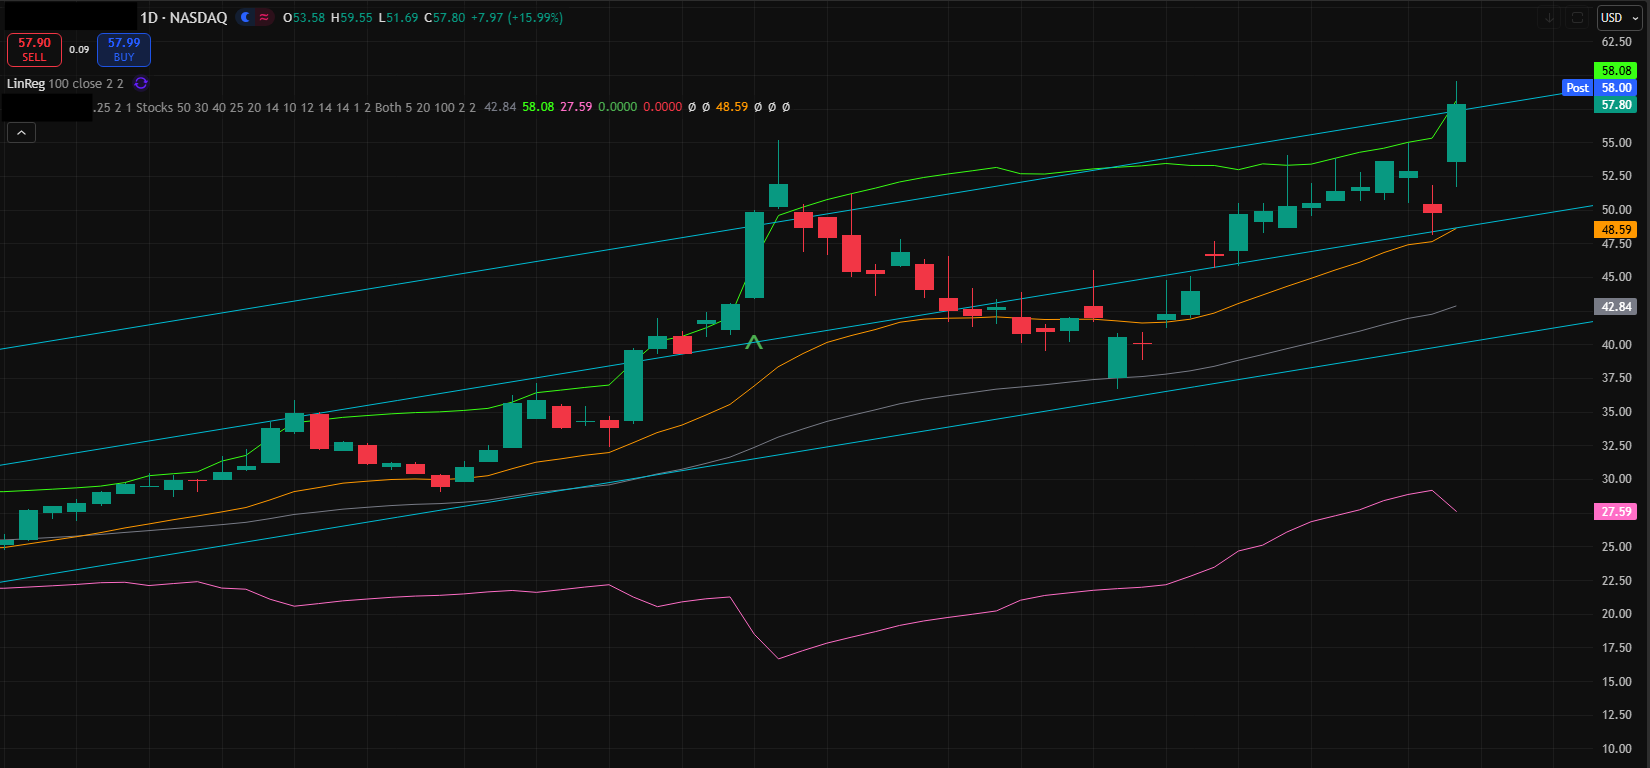 Figure 2: TradingView chart with the Tealeaves signal model applied.